Reporting and Finance
Dashboards
Forge provides two dashboard surfaces: the Home Dashboard (global overview of all events) and the event-level Overview tab (single-event snapshot). Both update in real time from Salesforce data.
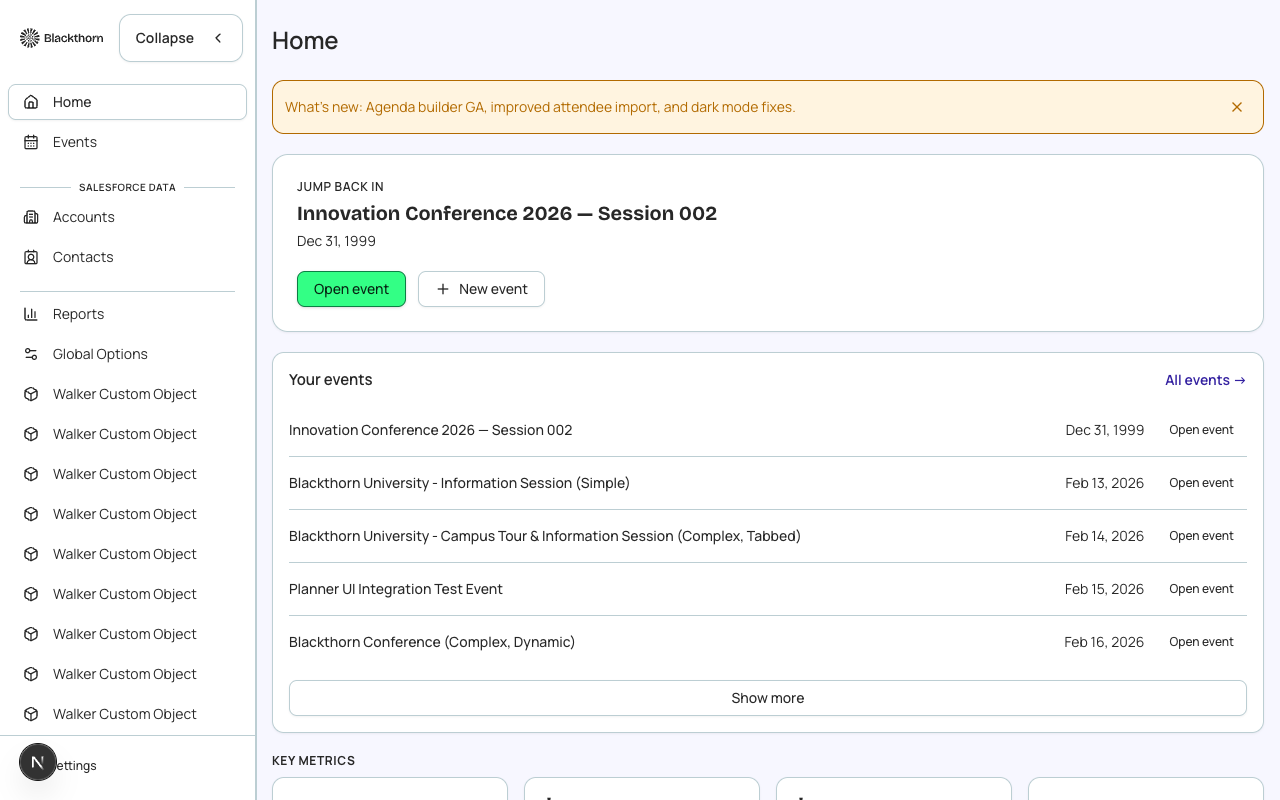
Home Dashboard
The Home Dashboard is the first screen you see after signing in. It provides a portfolio-level view across all your events.
| Widget | What it shows | Filters |
|---|---|---|
| Total Registrations | Sum of confirmed registrations across all active events in the selected date range | Date range, status filter |
| Revenue | Total gross revenue from all completed transactions across all events | Date range — does not include pending or refunded amounts |
| Upcoming Events | A chronological list of events starting in the next 90 days with their registration counts and status | None — always shows next 90 days |
| Recent Activity | A live feed of the latest registrations, cancellations, and check-ins across all events | None — shows last 20 events |
| Registration Trend | A line chart of daily registration volume across all events for the selected period | Date range, event group filter |
| Top Events by Registration | A ranked bar chart of your events by total confirmed registrations | Date range |
Event Overview Tab
Each event's Overview tab is a single-event dashboard providing at-a-glance status and quick-action shortcuts.
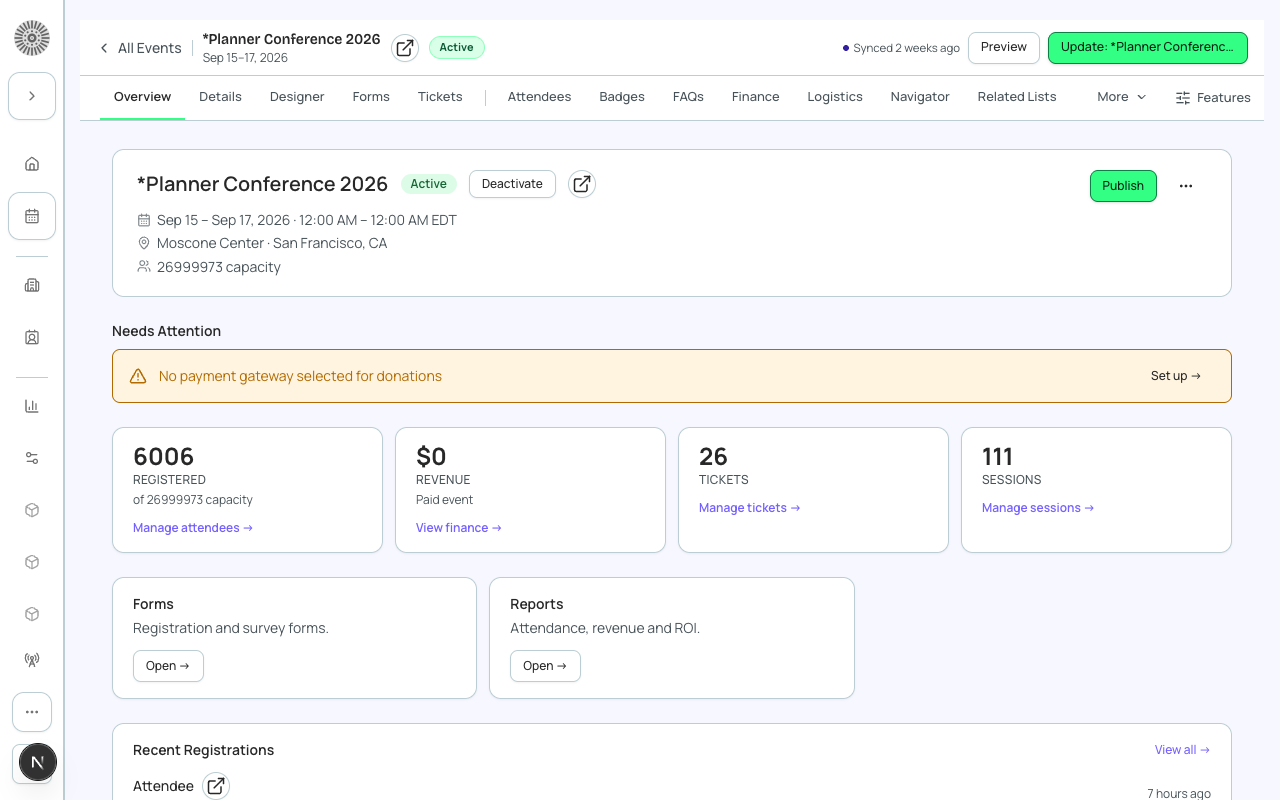
| Widget | What it shows |
|---|---|
| Registration Count | Total confirmed registrations, with a breakdown by status (Registered, Waitlisted, Cancelled) |
| Capacity Bar | Visual fill meter showing registrations vs. Maximum Attendees setting; turns red at 90%+ |
| Revenue Summary | Gross revenue, net revenue (after fees and refunds), and outstanding balance if invoicing is enabled |
| Ticket Breakdown | Donut chart showing the distribution of registrations by ticket type |
| Session Enrollment | Aggregate enrollment counts across all sessions for this event |
| Recent Registrations | The last 10 registrations with attendee name, ticket type, and timestamp |
| Checkin Status | Checked-in count vs. registered count — only meaningful on and after the event date |
| Quick Actions | One-click shortcuts to common tasks: Add Attendee, Send Email, Export, View Finance |
Date Range and Filtering
Dashboard widgets that support date filtering use the range selector in the top-right corner of the dashboard. Common presets include Today, This Week, This Month, Last 30 Days, Last 90 Days, and Custom. For multi-event dashboards, you can also filter by Event Group to see only a subset of your portfolio.
Dashboard data is Salesforce-live
All dashboard metrics are calculated from Salesforce data fetched in real time via the Forge API user. There is no separate data warehouse or cache for dashboard numbers — what you see reflects the current state of Salesforce records. For very large orgs (100k+ attendees), some aggregate queries may have a 30–60 second latency.
Exporting Dashboard Data
The Export button on any dashboard panel downloads the underlying data as a CSV. Dashboard exports reflect the current filter state — if you have filtered by date range or event group, the export will match. For larger exports or custom column selections, use the dedicated Exports module (Reporting > Exports).